Understanding Crypto Market Cycles: Phases, Predictions, and Strategies for 2026
 Aug, 1 2026
Ever feel like the crypto market is rigged against you? You buy when everyone is excited, panic when prices drop, and sell right before the next big jump. It’s frustrating, but it’s not random chaos. The cryptocurrency market moves in predictable loops called crypto market cycles. These cycles are driven by human psychology-specifically fear and greed-and structural events like Bitcoin’s halving. Understanding these patterns doesn’t guarantee you’ll get rich overnight, but it helps you stop making emotional mistakes that cost real money.
As we move through 2026, the rules of these cycles have changed. The old "buy every four years" advice is becoming less reliable due to institutional investors and new regulations. This guide breaks down exactly how these cycles work now, what signals to watch, and how to position yourself regardless of whether the market is crashing or soaring.
The Four Stages of a Crypto Cycle
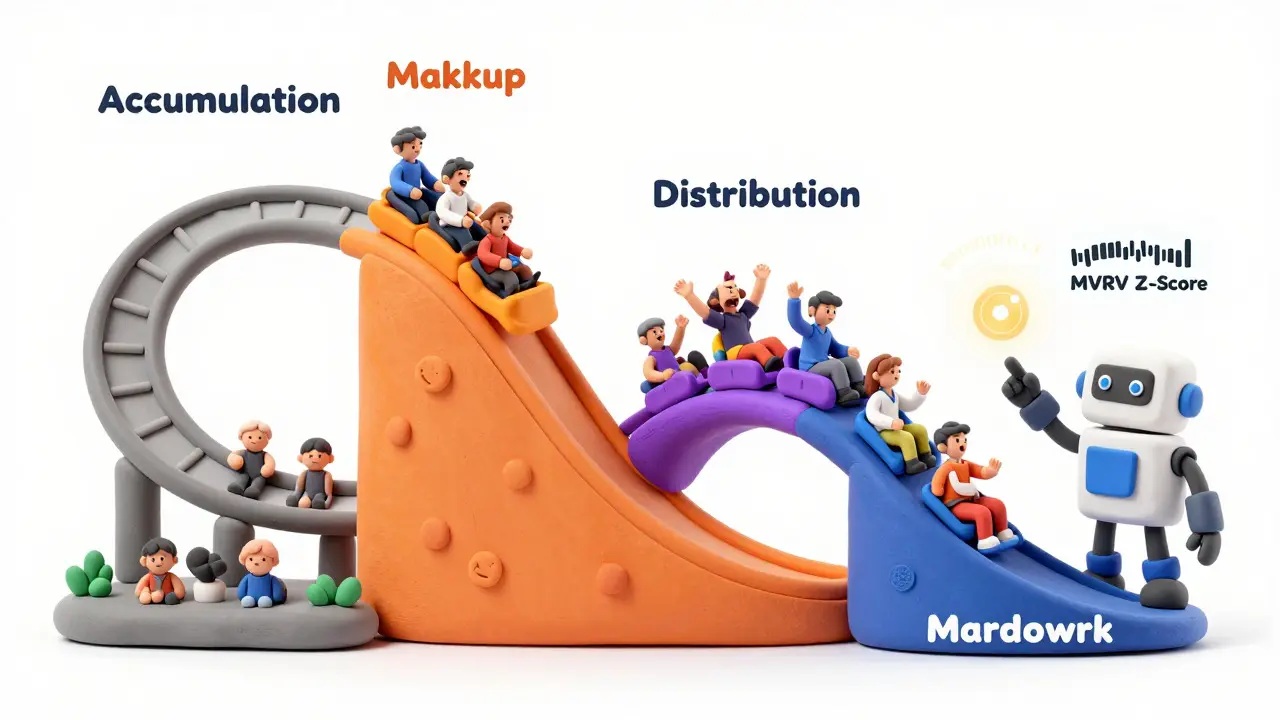
Every major cycle in cryptocurrency history follows a similar four-step pattern. Recognizing which stage you are in is the most critical skill for any investor. Here is how they break down:
- Accumulation (The Quiet Phase): This happens after a massive crash. Prices stay flat for 6 to 12 months. Most people are bored or scared. For example, in early 2020, Bitcoin hovered between $3,800 and $5,200. Volume drops significantly, and the Fear & Greed Index stays low (around 20-30). Smart money quietly buys here because the price is stable and cheap relative to future potential.
- Markup (The Rise): Prices start climbing steadily. At first, skeptics laugh, then they get curious. In the 2020-2021 cycle, Bitcoin went from $5,000 to $69,000. Trading volume explodes. The Fear & Greed Index rises into the 70s and 80s. This is where most retail investors jump in, seeing their friends make money.
- Distribution (The Bubble): Prices go parabolic, shooting up vertically. News headlines scream about crypto. Your taxi driver gives you tips on which coin to buy. Bitcoin exceeds previous highs by huge margins. Volatility spikes, with daily swings of 8-12%. Early investors and institutions start selling their holdings to latecomers who think the price will go up forever.
- Markdown (The Crash): The bubble bursts. Prices fall hard and fast. In 2022, Bitcoin dropped 77% from its peak. Panic sets in. People sell at the bottom out of fear. This phase usually lasts 12-18 months before settling back into Accumulation.
The Bitcoin Halving: The Old Clock That’s Breaking
For years, traders relied on the Bitcoin Halving, a programmed event that cuts the reward for mining new blocks in half roughly every four years. Historically, this supply shock triggered bull markets. After the 2012 halving, Bitcoin rose nearly 9,000%. After 2016, it surged over 10,000%.
However, the 2024 halving showed us something different. Instead of peaking 12-18 months later, Bitcoin hit a high just two months post-halving in June 2024. By late 2025, the price had corrected significantly. Why? Because the market has matured. Institutional players, who now control about 35% of trading volume, don’t wait for four-year cycles. They trade based on quarterly earnings, ETF flows, and macroeconomic data. Analysts like Willy Woo have noted that the traditional four-year cycle is no longer a standalone indicator. The clock is ticking faster now.
How Institutions Are Changing the Game
In 2017, Bitcoin was mostly traded by individuals. Today, it’s an asset class for Wall Street. The approval of spot Bitcoin ETFs in January 2024 was a watershed moment. Suddenly, pension funds and hedge funds could easily buy Bitcoin without dealing with wallets and private keys.
This shift has dampened the extremes of the cycles. Bear markets aren’t as deep; the 2022-2025 drawdown was 77%, compared to 89% in the 2014-2016 cycle. Bull markets are shorter and sharper. Algorithmic trading now accounts for 65% of crypto volume, meaning prices react instantly to news rather than building up slowly over weeks. If you’re trying to time the market using charts from 2017, you’re likely losing money to bots that execute trades in milliseconds.
Tools to Identify Where We Are Now
You don’t need a crystal ball, but you do need data. Relying on gut feeling is dangerous. Here are three concrete metrics used by professionals to identify cycle phases:
- Crypto Fear & Greed Index: Developed by Alternative.me, this index aggregates volatility, momentum, and social media sentiment. A reading below 25 indicates extreme fear (a good buying zone historically), while above 75 indicates extreme greed (a danger zone). In November 2025, the index showed readings consistent with late-cycle caution.
- MVRV Z-Score: This on-chain metric compares the market value of all bitcoins to their realized value (the price at which they last moved). When the MVRV Z-Score is high (above 7), the market is typically overvalued and near a top. When it’s low (below 1), it’s undervalued. Platforms like Glassnode provide this data.
- Bitcoin Dominance: This measures Bitcoin’s share of the total crypto market cap. During accumulation, dominance often holds steady or rises slightly. During altseasons (when smaller coins explode in price), dominance drops sharply. If Bitcoin dominance falls below 40% while the total market cap rises, you’re likely in the Distribution phase.
| Indicator | Accumulation Phase | Distribution/Bubble Phase |
|---|---|---|
| Fear & Greed Index | 20-30 (Extreme Fear) | 75-90 (Extreme Greed) |
| Trading Volume | Low (40-60% below peak) | Very High (300-500% above average) |
| Media Sentiment | Negative or Ignored | Euphoric Headlines |
| Volatility | Low (2-3% daily swings) | High (8-12% daily swings) |

Practical Strategy: How to Invest Without Losing Sleep
Knowing the theory is one thing; acting on it is another. Most people fail because they try to time the exact bottom or top. Instead, use these proven strategies:
- Dollar-Cost Averaging (DCA): Instead of dumping all your money in at once, invest a fixed amount weekly or monthly. Data from Swan Bitcoin shows DCA outperforms lump-sum investing by 22% during volatile accumulation phases. It removes emotion from the equation.
- Position Sizing: Never bet the farm. Limit your crypto exposure to 5-10% of your total portfolio during early bull phases. As the cycle progresses and greed increases, consider taking profits and moving them to stable assets.
- Take Profits Gradually: Don’t wait for the peak. Sell small portions as the price rises. If you bought at $30,000 and it hits $60,000, sell half. Now you have your initial investment back, and the rest is "free money." This psychological trick prevents panic selling when the crash comes.
What to Expect in Late 2026 and Beyond
The landscape in 2026 is defined by speed and regulation. With the EU’s MiCA framework fully implemented and increased scrutiny from the SEC, regulatory risks are priced in more efficiently. However, this also means fewer sudden, unexplained crashes due to exchange hacks or bans.
Analysts predict that future cycles may compress to 24-30 months instead of the traditional four years. This means windows of opportunity open and close faster. If you see a rapid surge in prices accompanied by mainstream media coverage, assume the Distribution phase is active. If the market feels dead and boring for six months straight, check your indicators-you might be in Accumulation. Stay disciplined, ignore the noise, and let the data guide your decisions.
Is the 4-year Bitcoin cycle still valid in 2026?
The strict 4-year timeline is becoming less reliable. While the halving event still occurs every four years, market peaks are arriving sooner due to institutional adoption and algorithmic trading. Recent cycles have compressed, with some analysts predicting 24-30 month cycles in the future.
How do I know if the market is in the Accumulation phase?
Look for low volatility, declining trading volume, and a Fear & Greed Index below 30. Prices typically range sideways for 6-12 months after a major crash. On-chain metrics like MVRV Z-Score being below 1 also signal undervaluation typical of accumulation.
What impact do Bitcoin ETFs have on market cycles?
ETFs have reduced the amplitude of cycles. Bear markets are less severe, and bull markets are shorter. Institutional inflows now account for a significant portion of price variance, making the market more efficient but also more sensitive to macroeconomic factors like interest rates.
Should I sell all my crypto when the Fear & Greed Index hits Extreme Greed?
Not necessarily all at once. Extreme Greed indicates high risk, but bubbles can last longer than expected. A better strategy is to scale out, selling portions of your holdings as the index remains high and volatility increases, ensuring you lock in profits before a potential correction.
Why did the 2024 halving cycle perform differently than previous ones?
The 2024 cycle saw a quicker peak and lower percentage gains compared to 2012 or 2016. This was largely due to pre-halving buying pressure from ETFs and increased market maturity. The supply shock from the halving was partially anticipated and priced in earlier by large institutional players.
Alex Di Mango
August 1, 2026 AT 16:32Great breakdown of the shifting dynamics here. It’s wild to think that the old four-year rule is basically dead now because of institutions and ETFs. I’ve been watching my portfolio since 2021, and honestly, the speed at which things move now compared to back then is exhausting. The part about algorithmic trading taking up 65% of volume really explains why my manual trades always seem late. Thanks for laying this out so clearly.
Lorraine Surringer
August 2, 2026 AT 23:39oh my god finally someone says it!!! i have been losing sleep over this stuff and every guru on youtube tells me to just HODL but they are all liars lol. you actually explained WHY we get wrecked. its not bad luck its just psychology and bots. thank you for saving my sanity even if i already missed the boat on the last pump 😭
Namrata Mapgaonkar
August 3, 2026 AT 18:54this is very helpful info :) i am from india and we see a lot of different trends here with local regulations changing fast. but the fear and greed index is universal right? i usually check it before buying anything small. nice article ! :)
Rita Dutta
August 4, 2026 AT 22:53The concept of time in crypto is merely an illusion constructed by the masses to cope with their financial inadequacy. While you speak of cycles, I speak of the eternal dance of entropy. The halving is but a ritualistic sacrifice to the digital gods of supply and demand. We are not investors; we are participants in a grand, chaotic theater where the script is written by algorithms and read by fools. The market does not care for your feelings or your charts. It consumes them. To try and predict the unpredictable is the height of human arrogance, yet here we are, clinging to our MVRV scores like life rafts in a hurricane. The bubble is not a phase; it is the state of being. Embrace the chaos, for order is a lie sold by those who wish to keep you compliant.
Eric Zehr
August 6, 2026 AT 03:03I completely agree with the point about DCA being superior to lump-sum investing during volatile accumulation phases. It removes the emotional element which is the biggest killer in this space. I started DCAing into BTC three years ago and despite the dips, the strategy has held up well. The key is consistency and not looking at the price every hour. It’s tough discipline, but necessary.
Paul Smith
August 7, 2026 AT 16:26This is super useful! 🙌 I’ve been trying to figure out if we are still in distribution or heading back to accumulation. The volatility lately has been crazy. Do you think the EU MiCA framework will actually stabilize things more or just add another layer of complexity? 👀💸
Rodmun Tarnowski
August 8, 2026 AT 09:41A most illuminating piece., indeed.; The transition from retail-dominated markets to institutional hegemony is., as noted., a paradigm shift of monumental proportions..; One must remain vigilant., however., regarding the implications of such centralization..; The dampening of extremes., while seemingly beneficial., may also indicate a loss of organic market discovery mechanisms..; Prudence is advised., always..;
Eden Tadesse
August 9, 2026 AT 23:23i totally get what u mean bout the taxi driver tips lol that happened to my uncle last cycle he lost so much money bcuz he listened to random people instead of doing research. scary how easy it is to lose everything when ur greedy. thanks for the reminder to stay calm and use data not emotions!!
Matthew Smith
August 11, 2026 AT 15:42the moral decay of society is evident in our obsession with quick riches through digital tokens. we have abandoned hard work and value creation for speculation and gambling. the cycles described are merely symptoms of a deeper spiritual emptiness. until we address the root cause of greed we will continue to be slaves to these artificial constructs. wake up sheeple
Amor Jordan
August 13, 2026 AT 04:55I feel so seen by this post. It’s terrifying how much control our emotions have over our wallets. I remember panicking selling in 2022 and feeling sick for weeks. Reading this makes me want to be better, to actually look at the Fear & Greed index instead of just staring at red numbers crying. It’s hard to stay disciplined when everyone around you is either euphoric or devastated. But knowing there’s a pattern gives me a little bit of hope that I can learn from this. Thank you for writing this with such clarity. It feels like a deep breath after holding it for months.